GROVE
Enabling vegans & vegetarians to find restaurants quicker and more effortlessly.
Notes:
-This was a course project (Research Methods for HCI)
-Due to the COVID-19 pandemic, this project was completed fully virtually
WHAT I DID
My role: UX Researcher
Analyses of existing systems
In depth user interviews
User archetype building
Journey mapping
Digital Survey
UX workshop
User Stories
Prototype evaluation
TOOLS USED
Microsoft Teams
Mural App
Figma
Qualtrics
Tableau
TEAM MEMBERS
DURATION
August to December 2020
BACKGROUND
In our Research Methods for HCI class, we were given a prompt "Nutrition on the Go", for our group project. We learned about the difficulties many close friends and family face eating out due to their dietary needs as vegan or vegetarians. Hence, we decided to explore this growing problem space.
PROBLEM
When eating out, many vegans and vegetarians have to do extensive research to peruse menus, dish descriptions, taste and quality, prices, and etc for multiple restaurants before a meal. It doesn’t stop there; when at the selected restaurant, they might face inaccurate descriptions, dish unavailabilities, and lack of options.
PROJECT GOALS
How can we make dining out a less stressful process for vegans and vegetarians?
OUR SOLUTION
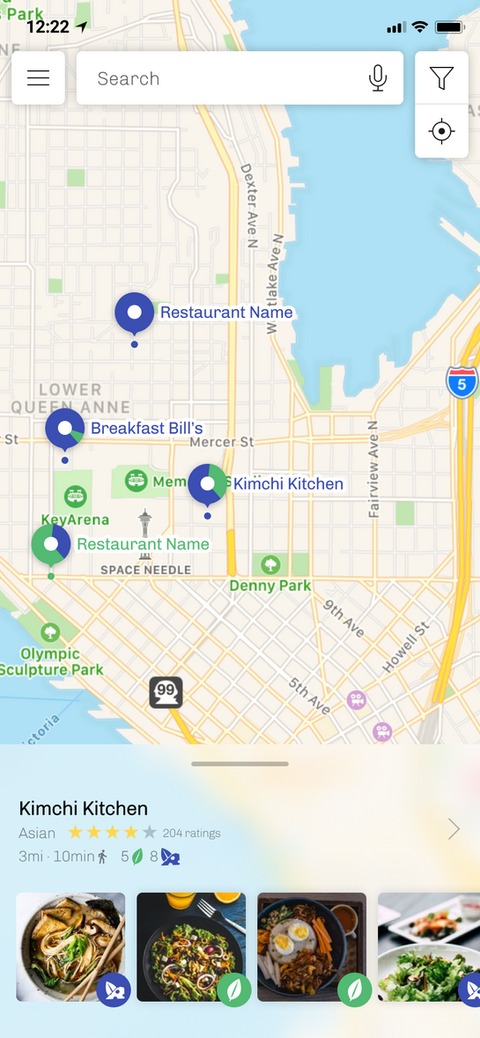
Specialized search
Instantly see relevant vegan- or vegetarian-friendly restaurants near you. Apply filters to refine the results or create your own search.
Scheduled Recommendations Bulletin & Local Discovery
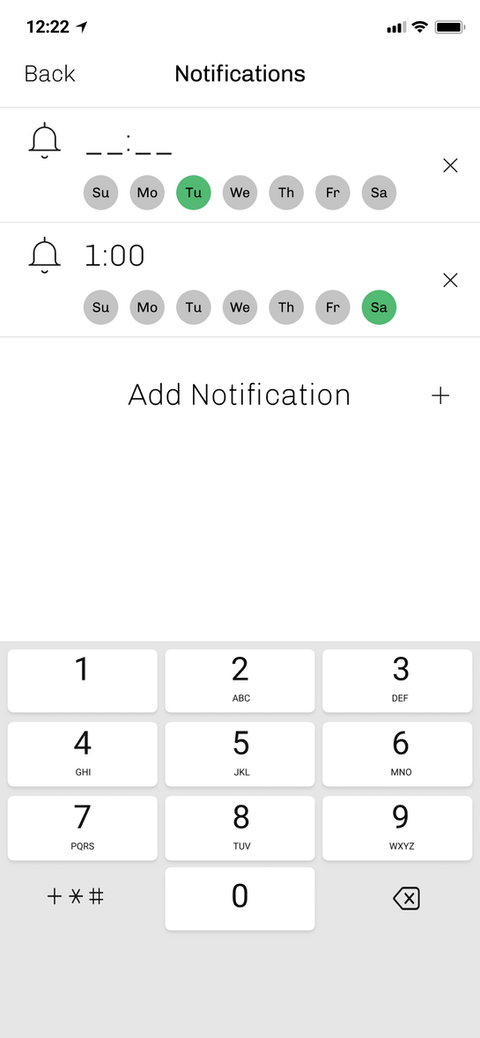
Don’t get overwhelmed with notifications - receive scheduled notifications for recommended restaurants in your vicinity. The app saves relevant restaurants as you pass by places and sends you a list at the times you set.
OUR APPROACH

Research & Design
The research encompassed four phases. In Discover the Space, we explored the problem space. We conducted desk research, literature review, existing systems analysis, and market analysis to under the broad landscape and potential opportunity gaps.
In User Needs & Design Criteria, we delved deeper to understand key user needs and start gathering design requirements; this was to defined our problem scope. We leveraged semi-structured interviews, UX workshop, and digital survey methods. We analyzed our findings into an affinity map, user journey map, and design implications.
In the Design Ideas & Feedback phase, we alternated between design and research. [Building upon previous research findings] We brainstormed design concepts and then tested them with user feedback sessions. Upon analyzing the feedback, we selected three concepts and created wireframes; we then conducted usability testings. We analyzed these findings into design implications to define design criteria.
In Design Evaluation & Validation, we designed the prototype based on the design criteria and previous research findings. We tested this prototype design with expert heuristic evaluations and usability test with users. We analyzed these findings and translated them into meaningful insights for next steps and recommendations.


Analysis of existing systems
We found that despite growing popularity of these plant-based diets, there were few centralized resources available. Thus, users would have to jump from one platform - e.g. Google Maps to Happy Cow to UberEats - to another, in order to get the information they need.
Market analysis
We found that this was a growing industry, with plant-based food sales grew approximately 8.1% in 2017 alone and exceeded $3.1 billion last year. As well as growing interest seen in the chain restaurants' moves such as Burger King's Impossible Whopper and Del Taco’s plant-based tacos. Thus, we believed there was potential for user and economical benefits from exploring this space.


Semi-structured interviews
Here, we learned that our target users often faced challenges with menu legibility & consistency in identifying plant-based options, unreliable availability of item, social discomfort to explain to servers about their needs, and extensive research & planning needed before eating out (which impedes spontaneity in their lifestyle).
Affinity map
We coded our user interview notes and transcripts into sticky notes and analyzed them in an Affinity map. This way, user Wants (e.g. price, proximity), Pain Points (e.g. no one-stop resource for info, unclear menu, etc.) , Motivations, and Goals (good experience dining out) emerged.


UX workshop
We collaborated with users to create a current state journey map which informed us of the end-to-end user experience, from needing to eat out to finishing the meal; we covered their actions, pain points, hacks, touch points (devices, etc.), and emotions at each step.
Digital survey
We deployed a digital survey across 4 days on major platforms (e.g. Facebook groups and sub-Reddits). More than 300 responses affirmed our previous research that discovering and comparing restaurants are amongst the highest pain points that users currently face.

Journey Map
Finally, we combined data from the digital survey and user feedback on the Journey Map to define our problem area to ‘discovering & comparing restaurants’ phases as we found them to have the most pain points and urgency for our users.


User feedback: sketched concepts
We ran user feedback sessions using storyboard to understand user attitudes, concerns, and affect towards our concept ideas. We employed Rose, Thorn, Bud activity to encourage user thought and feedback.
User feedback analysis
Once we had compiled our sketch feedback, we conducted a debrief session for the consolidated findings. We organized the issues into their descriptions, evidence, and design recommendations. This method informed us to scratch more ‘novel’ ideas that were not effective for users, and focus on two concepts that users would prefer using.
Usability test
We moved on to develop user flows in tasks & features for the top two concepts, and then tested them with users using a Wizard of Oz method. The feedback then informed about 23 detailed changes; including, tweaking our vegan & vegetarian icons to be more distinctive from the other, ridding a crowd-sourced menu database feature, and adding more accessibility features like voice command to select action buttons.


Expert heuristic evaluations
Using Figma, Microsoft Teams, and Mural (for note taking), we conducted expert heuristic evaluations. Overall, the feedback were positive with minor improvements to be made e.g. UX writing, add onboarding tutorial.
Usability test
We measured user task-success rates for our usability tests, in addition to recording user think-aloud feedback. We recorded 97 comments and got 5 SUS surveys from our 5 usability sessions. Similarly, the feedback informed us of detailed improvements to the system design.
Themes mapping
We organized both the expert and user feedback based on the user interface (UI) elements, and identified themes for each UI section.
We translated these into design recommendations. Some highlights include re-designing the “unintuitive” vegan & vegetarian icons and explicit explanation for the ‘Scheduled Recommendations Bulletin’ feature which was novel for all of our users.
DESIGN
In R3, we converged our scope and did internal team design brainstorm to generate and vote on team ideas based off our research findings. We then storyboarded the selected ideas to gauge user feedback, using the Rose, Thorn, Bud method. With these findings, we narrowed down our design concepts and created wireframes for the key features' user flow. After testing them with users, we translated our findings into design decisions for our prototype.
In R4, we revised our design criteria based on user feedback from previous findings. We then designed high-fidelity screens for specific features and user flows. We tested this prototype with experts and users to gain insights for next steps and recommendations.
HIGH-FIDELITY SCREENS
REFLECTIONS
Focus on the user
Focusing on the user needs allowed us to built a system that catered to urgent and frequent features that users found helpful. It steered us from overloading the system with frivolous features.
Do what you can with what you have
Despite the global COVID-19 pandemic, we adapted by going fully online and using the tools at our disposal. We leveraged Teams, Mural, and Figma to collaborate with each other and our stakeholders. We also set up more team check points and user research sessions that might not be possible if we/users were commuting.


